Posts

Showing posts from 2019

Is negative equity bad in stocks?

Image
Is negative equity bad in stocks? Most of the time yes! But not always. In fact, having negative equity, can be a sign of an excellent company. It took me a while to understand this, because is not obvious. Negative equity, most of the time, means that your liabilities are so high that (in theory) shareholders owe money to their lenders. A clear example of this happens when the real estate market crashes and the owner of the house owes the bank more than what the house is worth. When this happens most people just walk away from their houses and let the bank have the house; this is what happened to many people in the crash of 2008. Of course, in stocks you have limited liability as a shareholder, so nobody is going to come and knock on your door to collect their debt. It would mean you lost your investment... Or does it? Except that some great companies also show negative equity; for example, it just happened to Home Depot HD. The stock price keeps going up b...

A Different view on Fannie Mae (FNMA) and Freddie Mac (FMCC) "Optionality has value"!

Image
A Different view on  Fannie Mae (FNMA) and Freddie Mac (FMCC), an  issue is rather complex.  Here I may refer to both institutions as "government-sponsored entities" or ("GSEs"). But YOU as an investor should focus on what's knowable and controllable. Here is what the market is missing an my variant perspective: "Optionality has value" ! Here is my invitation to you investor: see Fannie Mae and Freddie Mac at current price as an option , that could go to $0 or to $17.55 each. You would really be paying for the optionality. You just bought an option, but not only that, this one doesn't expire.  how much would that option be worth? for a "know nothing about the company" kind of investor using a Black an Scholes kind of formula works pretty well. Even though we don't want to use it for prolonged periods of time, since the formula stops working basically. Charlie Munger on Black Scholes Option Pricing Model (2003) -   https...

Real estate investment N 71st Dr Phoenix, AZ 85033

Image
Summary of the investment (6 years, 5 months) 33.6%/year  compounded investment sep 11, 2012  -$9500  rent cash flow approximately : $200/month (65 months) = 13,000 profit after sale: $82,708.99 income in the live of the investment: $95,708.99 Return over investment capital =  $95,708.99/ -$11.000 = 870% . 33.6%/year  compounded I bought the LLC that owned this house around sept 2012 for $-11.000, I did need 6 years later to come up with $15.000 for a lawsuit to clean title, and it took around a year and many headicks to make it work.  Cash that I used to buy  the LLC: -$11.0000 (sep 2012)    Mortgage: -$64.000 (sep 2012) Mortgage payment (including piti expenses) -$636.31 (sep 2012) Value in (sep 2012) Rent: $1095 Mortgage -$549.47 Management: $109.5,   Cash Flow: $ Sold (2/11/2019): $150.000, Profit: $82,708.99 The estimated value of the property when I bought it was about $56.000...

Understanding Micron Technology Inc (NAS:MU) - How much is it worth?

Image
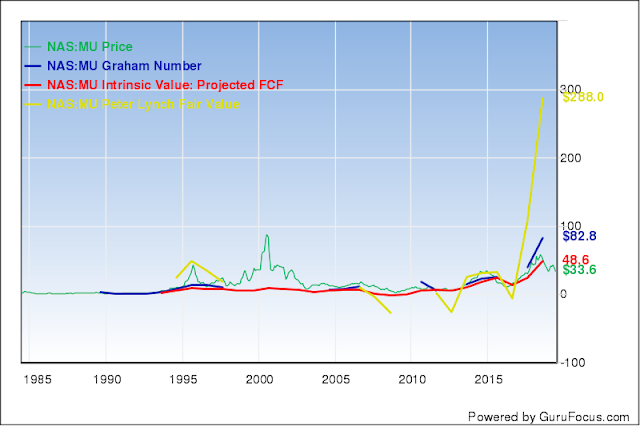
This post is a complementary post of  Understanding Micron Technology Inc (NAS:MU) , make sure to go and see it.  As we saw in the original post, the best ways to look at micron are on the PS ratio, and to value it to use FCF projected. Here we are going to make a calculation of the Free cash flow (FCF) valuation. But be carefull! as you see in the chart below the FCF valuation normally lags fundamental data like sales drops, like is happening right now. So we are going to be a little bit more careful in our calculations bellow. First question to answer: What are the timeframes for sales cycles with micron? Why? because this is a cyclical stock, and we want to make sure to take that on account. To have a approximately good answer we look into this revenue chart (I added net income just for fun, and market capitalization so we don't have share buybacks or emissions as a distortion) Please read the article "Blog's "read me first"" Terms A...

Understanding Micron Technology Inc (NAS:MU) - Statistical analysis best valuation ratios

Image
This post is a complementary post of  Understanding Micron Technology Inc (NAS:MU) , make sure to go and see it.  Here I'm just going to post the variables that I have available to quickly discern what historical data have correlated the best with prices of Micron, the objective is to dig in better on the financial statements, not to predict in any way or form since pass events are not necessarily good indicators of future price movements,  " correlation  does  not  imply  causation "  nothing supplements critical thinking.  Valuation Ratios Correlations rank PE Ratio -0.02948 13 Price-to-Owner-Earnings 0.045348 10 PB Ratio 0.322649 4 Price-to-Tangible-Book 0.332873 3 Price-to-Free-Cash-Flow 0.032263 11 Price-to-Operating-Cash-Flow 0.049925 9 PS Ratio 0.358271 1 PEG Ratio 0.124188 8 EV-to-Revenu...

Understanding Micron Technology Inc (NAS:MU) - Statistical analysis Best Valuation and Quality Ratios

Image
This post is a complementary post of  Understanding Micron Technology Inc (NAS:MU) , make sure to go and see it.  Here I'm just going to post the variables that I have available to quickly discern what historical data have correlated the best with prices of Micron, the objective is to dig in better on the financial statements, not to predict in any way or form since pass events are not necessarily good indicators of future price movements,  " correlation  does  not  imply  causation "  nothing supplements critical thinking.  Whats has been the best way to value or track quality in micron stock? Valuation Ratios Correlations rank PE Ratio -0.02948 30 Price-to-Owner-Earnings 0.045348 27 PB Ratio 0.322649 12 Price-to-Tangible-Book 0.332873 10 Price-to-Free-Cash-Flow 0.032263 28 Price-to-Operating-Cash-Flow 0.049925 26 PS Ratio ...

Understanding Micron Technology Inc (NAS:MU)

Image
The first thing you'll notice is that Micron is undervalued mostly however you see it. Is hard to ignore that P/E of 3.12, in theory you should get your money back ever 3 years, and that for every dollar of their 30 billion in sales, they keep 50 cents (operating margins of almost 50%). But just before you run and buy Micron, take a look. Micron is a very cyclical market. It goes up and down like a yoyo. that makes it hard to value, specially because its net income is even more chaotic: Here is the problem, expectations are that revenues are about to fall... a lot, because of prices of their products are: As a reference last time revenues lower significantly was in 2016, they operated at a loss that year. stock price low was around $10 Is debt a problem? actually no. Micron Technology Inc Annual Data Aug09 Aug10 Aug11 Aug12 Aug13 Aug14 Aug15 Aug16 Aug17 Aug18 Debt-to-EBITDA 5.43 0.59 0.72 2.08 1.82 1.27 1.31 3.16 1.16 0.24 ( Current Portion of...