Understanding Micron Technology Inc (NAS:MU) - Statistical analysis Best Valuation and Quality Ratios
This post is a complementary post of Understanding Micron Technology Inc (NAS:MU), make sure to go and see it.
Here I'm just going to post the variables that I have available to quickly discern what historical data have correlated the best with prices of Micron, the objective is to dig in better on the financial statements, not to predict in any way or form since pass events are not necessarily good indicators of future price movements, "correlation does not imply causation" nothing supplements critical thinking.
Whats has been the best way to value or track quality in micron stock?
As you can see the top 3 correlations are Graham number, Projected FCF, Peter Lynch Fair Value
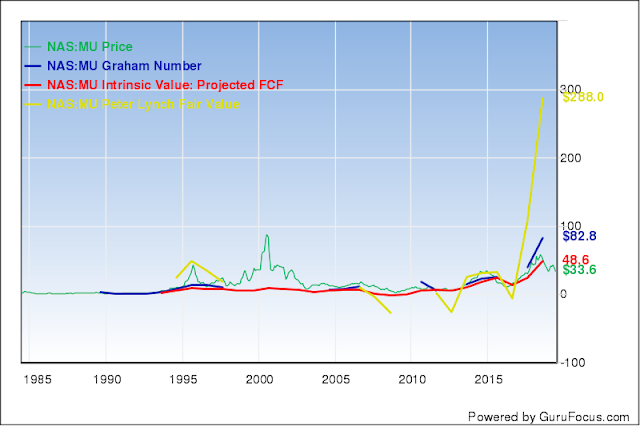
As you can see from the chart the smother valuation method in the long term is Projected FCF, even though Graham Number and Peter Lynch Fair Value have currently bigger correlations, they tend to overshoot.
Please read the article "Blog's "read me first"" Terms And Conditions Of Use All content provided on this blog is for informational purposes only. The owner of this blog makes no representations as to the accuracy or completeness of any information on this site or found by following any link on this site. The owner of this blog will not be liable for any errors or omissions in this information nor for the availability of this information. The owner will not be liable for any losses, injuries, or damages from the display or use of this information. This terms and conditions is subject to change at anytime with or without notice.
Here I'm just going to post the variables that I have available to quickly discern what historical data have correlated the best with prices of Micron, the objective is to dig in better on the financial statements, not to predict in any way or form since pass events are not necessarily good indicators of future price movements, "correlation does not imply causation" nothing supplements critical thinking.
Whats has been the best way to value or track quality in micron stock?
| Valuation Ratios | Correlations | rank | ||
| PE Ratio | -0.02948 | 30 | ||
| Price-to-Owner-Earnings | 0.045348 | 27 | ||
| PB Ratio | 0.322649 | 12 | ||
| Price-to-Tangible-Book | 0.332873 | 10 | ||
| Price-to-Free-Cash-Flow | 0.032263 | 28 | ||
| Price-to-Operating-Cash-Flow | 0.049925 | 26 | ||
| PS Ratio | 0.358271 | 7 | ||
| PEG Ratio | 0.124188 | 22 | ||
| EV-to-Revenue | 0.338189 | 9 | ||
| EV-to-EBITDA | -0.00694 | 29 | ||
| EV-to-EBIT | -0.05721 | 32 | ||
| Earnings Yield (Joel Greenblatt) % | 0.309885 | 13 | ||
| Forward Rate of Return (Yacktman) % | 0.269556 | 16 | ||
| Shiller PE Ratio | 0.26993 | 15 | ||
| Dividend Yield % | -0.24374 | 37 | ||
| Valuation and Quality | ||||
| Market Cap | ||||
| Enterprise Value (Current M) | ||||
| Enterprise Value ($M) | ||||
| Month End Stock Price | ||||
| Net Cash per Share | -0.37092 | 38 | ||
| Net Current Asset Value | 0.161774 | 20 | ||
| Net-Net Working Capital | -0.09742 | 33 | ||
| Intrinsic Value: Projected FCF | 0.830343 | 2 | ||
| Median PS Value | ||||
| Median PB Value | ||||
| Peter Lynch Fair Value | 0.741184 | 3 | ||
| Graham Number | 0.835175 | 1 | ||
| Earnings Power Value (EPV) | 0.155963 | 21 | ||
| Altman Z-Score | 0.291574 | 14 | ||
| Piotroski F-Score | 0.370654 | 6 | ||
| Beneish M-Score | 0.097015 | 23 | ||
| Scaled Net Operating Assets | -0.12358 | 34 | ||
| Sloan Ratio % | 0.330129 | 11 | ||
| Current Ratio | 0.174935 | 19 | ||
| Quick Ratio | 0.204097 | 18 | ||
| Interest Coverage | -0.42847 | 39 | ||
| Highest Stock Price | ||||
| Lowest Stock Price | ||||
| Shares Buyback Ratio % | -0.03057 | 31 | ||
| YoY Rev. per Sh. Growth | -0.20223 | 36 | ||
| YoY EPS Growth | 0.346821 | 8 | ||
| 5-Year EBITDA Growth Rate (Per Share) | 0.087321 | 24 | ||
| Shares Outstanding (Basic Average) | 0.595961 | 4 | ||
| Shares Outstanding (EOP) | 0.590826 | 5 | ||
| Beta | -0.14919 | 35 | ||
| Number of Shareholders | 0.07901 | 25 | ||
| Number of Employees | 0.238851 | 17 | ||
As you can see the top 3 correlations are Graham number, Projected FCF, Peter Lynch Fair Value

As you can see from the chart the smother valuation method in the long term is Projected FCF, even though Graham Number and Peter Lynch Fair Value have currently bigger correlations, they tend to overshoot.
Please read the article "Blog's "read me first"" Terms And Conditions Of Use All content provided on this blog is for informational purposes only. The owner of this blog makes no representations as to the accuracy or completeness of any information on this site or found by following any link on this site. The owner of this blog will not be liable for any errors or omissions in this information nor for the availability of this information. The owner will not be liable for any losses, injuries, or damages from the display or use of this information. This terms and conditions is subject to change at anytime with or without notice.