Posts

Understanding Micron Technology Inc (NAS:MU) - How much is it worth?

Image
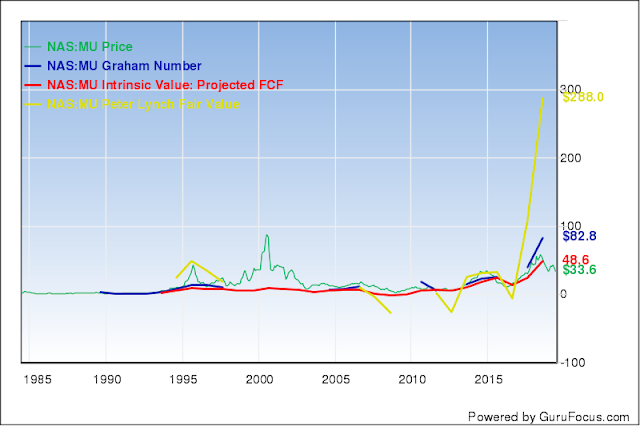
This post is a complementary post of  Understanding Micron Technology Inc (NAS:MU) , make sure to go and see it.  As we saw in the original post, the best ways to look at micron are on the PS ratio, and to value it to use FCF projected. Here we are going to make a calculation of the Free cash flow (FCF) valuation. But be carefull! as you see in the chart below the FCF valuation normally lags fundamental data like sales drops, like is happening right now. So we are going to be a little bit more careful in our calculations bellow. First question to answer: What are the timeframes for sales cycles with micron? Why? because this is a cyclical stock, and we want to make sure to take that on account. To have a approximately good answer we look into this revenue chart (I added net income just for fun, and market capitalization so we don't have share buybacks or emissions as a distortion) Please read the article "Blog's "read me first"" Terms A

Understanding Micron Technology Inc (NAS:MU) - Statistical analysis best valuation ratios

Image
This post is a complementary post of  Understanding Micron Technology Inc (NAS:MU) , make sure to go and see it.  Here I'm just going to post the variables that I have available to quickly discern what historical data have correlated the best with prices of Micron, the objective is to dig in better on the financial statements, not to predict in any way or form since pass events are not necessarily good indicators of future price movements,  " correlation  does  not  imply  causation "  nothing supplements critical thinking.  Valuation Ratios Correlations rank PE Ratio -0.02948 13 Price-to-Owner-Earnings 0.045348 10 PB Ratio 0.322649 4 Price-to-Tangible-Book 0.332873 3 Price-to-Free-Cash-Flow 0.032263 11 Price-to-Operating-Cash-Flow 0.049925 9 PS Ratio 0.358271 1 PEG Ratio 0.124188 8 EV-to-Revenue 0.338189 2 EV-to-EBITDA -0.0

Understanding Micron Technology Inc (NAS:MU) - Statistical analysis Best Valuation and Quality Ratios

Image
This post is a complementary post of  Understanding Micron Technology Inc (NAS:MU) , make sure to go and see it.  Here I'm just going to post the variables that I have available to quickly discern what historical data have correlated the best with prices of Micron, the objective is to dig in better on the financial statements, not to predict in any way or form since pass events are not necessarily good indicators of future price movements,  " correlation  does  not  imply  causation "  nothing supplements critical thinking.  Whats has been the best way to value or track quality in micron stock? Valuation Ratios Correlations rank PE Ratio -0.02948 30 Price-to-Owner-Earnings 0.045348 27 PB Ratio 0.322649 12 Price-to-Tangible-Book 0.332873 10 Price-to-Free-Cash-Flow 0.032263 28 Price-to-Operating-Cash-Flow 0.049925 26 PS Ratio 0.358271 7 PEG Ratio 0.124188

Understanding Micron Technology Inc (NAS:MU)

Image
The first thing you'll notice is that Micron is undervalued mostly however you see it. Is hard to ignore that P/E of 3.12, in theory you should get your money back ever 3 years, and that for every dollar of their 30 billion in sales, they keep 50 cents (operating margins of almost 50%). But just before you run and buy Micron, take a look. Micron is a very cyclical market. It goes up and down like a yoyo. that makes it hard to value, specially because its net income is even more chaotic: Here is the problem, expectations are that revenues are about to fall... a lot, because of prices of their products are: As a reference last time revenues lower significantly was in 2016, they operated at a loss that year. stock price low was around $10 Is debt a problem? actually no. Micron Technology Inc Annual Data Aug09 Aug10 Aug11 Aug12 Aug13 Aug14 Aug15 Aug16 Aug17 Aug18 Debt-to-EBITDA 5.43 0.59 0.72 2.08 1.82 1.27 1.31 3.16 1.16 0.24 ( Current Portion of

Understanding Micron Technology Inc (NAS:MU) - Statistical analysis

This post is a complementary post of  Understanding Micron Technology Inc (NAS:MU) , make sure to go and see it.  Here I'm just going to post the variables that I have available to quickly discern what historical data have correlated the best with prices of Micron, the objective is to dig in better on the financial statements, not to predict in any way or form since pass events are not necessarily good indicators of future price movements,  " correlation  does  not  imply  causation "  nothing supplements critical thinking.  Per Share Data Quarters 1989-05 to  2019-02 correlation with market cap    rank Revenue per Share 0.85882407 2 EBITDA per Share 0.83155858 12 EBIT per Share 0.75153725 36 Earnings per Share (Diluted) 0.7754951 28 EPS without NRI 0.77816089 27 Owner Earnings per Share (TTM) 0.74074223 40 Free Cash Flow per Share 0.59979572 64 Operating Cash Flow per Share 0.84946269 7 Dividends per Share -0.11050196 155 Book Value per Share 0.78978552 24